Background—well/aquifer metrics
Type of well determines the metrics it can generate
Monitoring well:
A monitoring well can only report static water level on a remote basis.
Operating well—non-cycling:
With a non-cycling operating well (pump rate < refill rate) the well depth equilibrates to a "drawdown" level. When the pump stops operating, well recovery can be measured as well as rate of refill as function of depth.
Operating well—cycling:
A cycling well (pump rate > refill rate) generates even more metrics: percent recovery for each pump cycle, the duration of a CFW cycle and sustainable yield.
A cycling well generates a rich set of metrics that allow for a detailed understanding of the structure of the aquifer.
Well/aquifer metrics generated by different types of wells
| Metric | Monitoring well | - - - Operating well - - - | |||
|---|---|---|---|---|---|
| Non-cycling* | Cycling** | ||||
| While pumping | After pumping ceases | While pumping | After pumping ceases | ||
| Static water level (SWL) | |||||
| Drawdown | |||||
| Water yield | |||||
| Recovery to 95% SWL | |||||
| Recovery vs time | |||||
| Rate of refill as function of depth of water in well | |||||
| Water yield vs cumulative pumped | |||||
| % recovery for each pump cycle | |||||
| Well-level sustainable yield | |||||
* Non-cycling operation: pump rate < fill rate. Pump operates continuously without draining well
** Cycling operation: pump rate > fill rate. Pump cycles on and off as it drains well and then waits for well to refill before restarting
A well pump disturbs the aquifer. A disturbed aquifer is a rich source of data.
When a well pump is turned on, it is a shock to the aquifer; it induces a significant flow of water toward the well. Similarly, when the pump stops operating, the induced flow ceases and the aquifer reverts to its undisturbed state. How the aquifer responds to these sharp local changes in condition reveals a lot about its structure. Monitoring how the depth of water in the well changes simultaneously with monitoring the water output from the well during these perturbations provides a data goldmine that allows us to understand the behavior of the aquifer.
Cormit's cloud-based analytic engine is able to generate detailed well/aquifer metrics from such data.
A cycling well generates the most detailed metrics
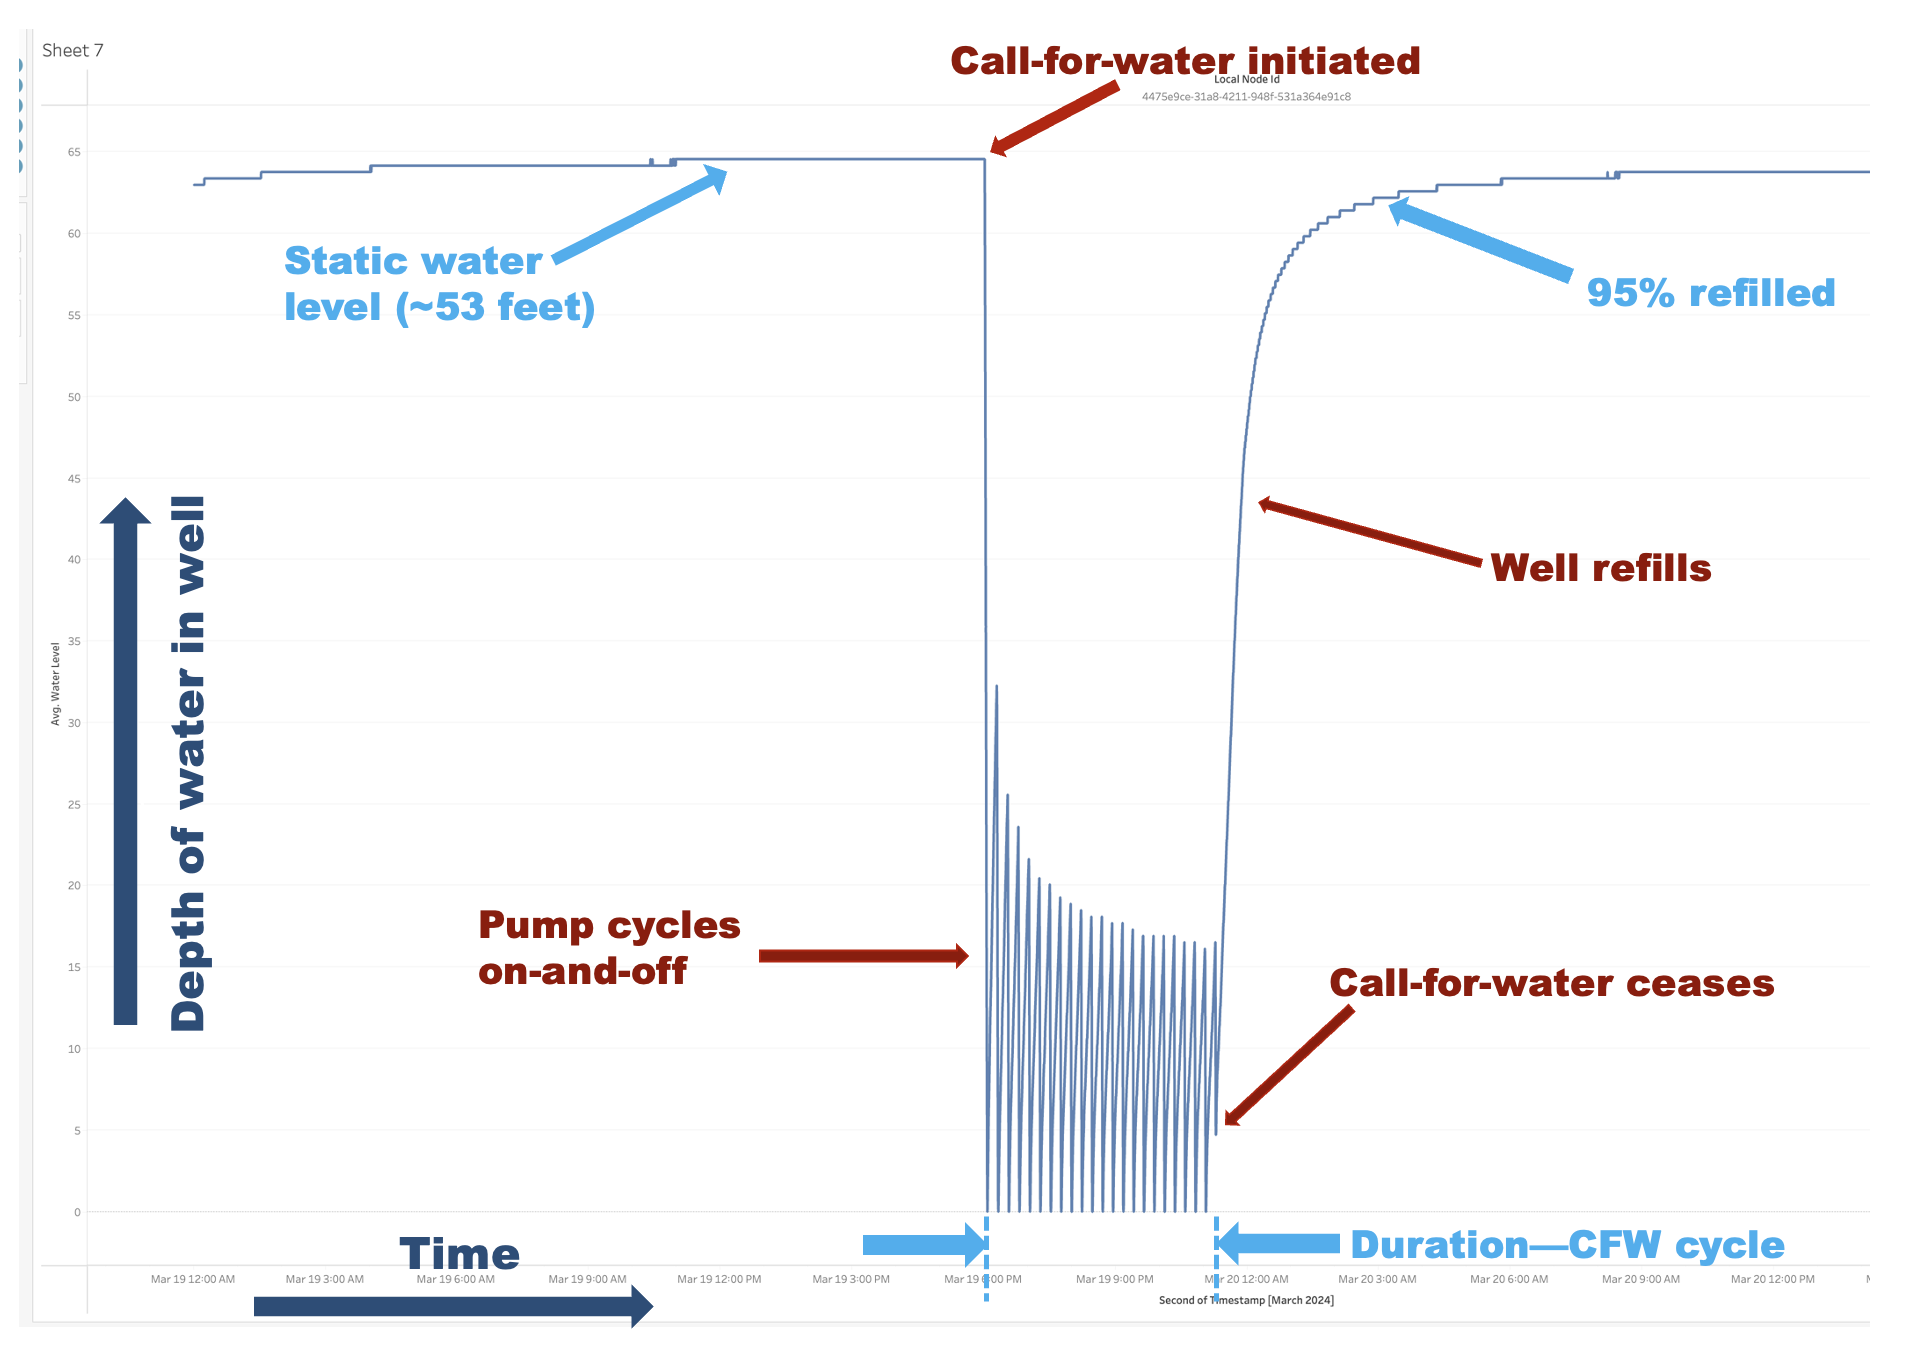
The image shows the depth of water in a well over the period when a well pump starts operating, cycles on-and-off until the tank or reservoir is filled, and then stops operating.
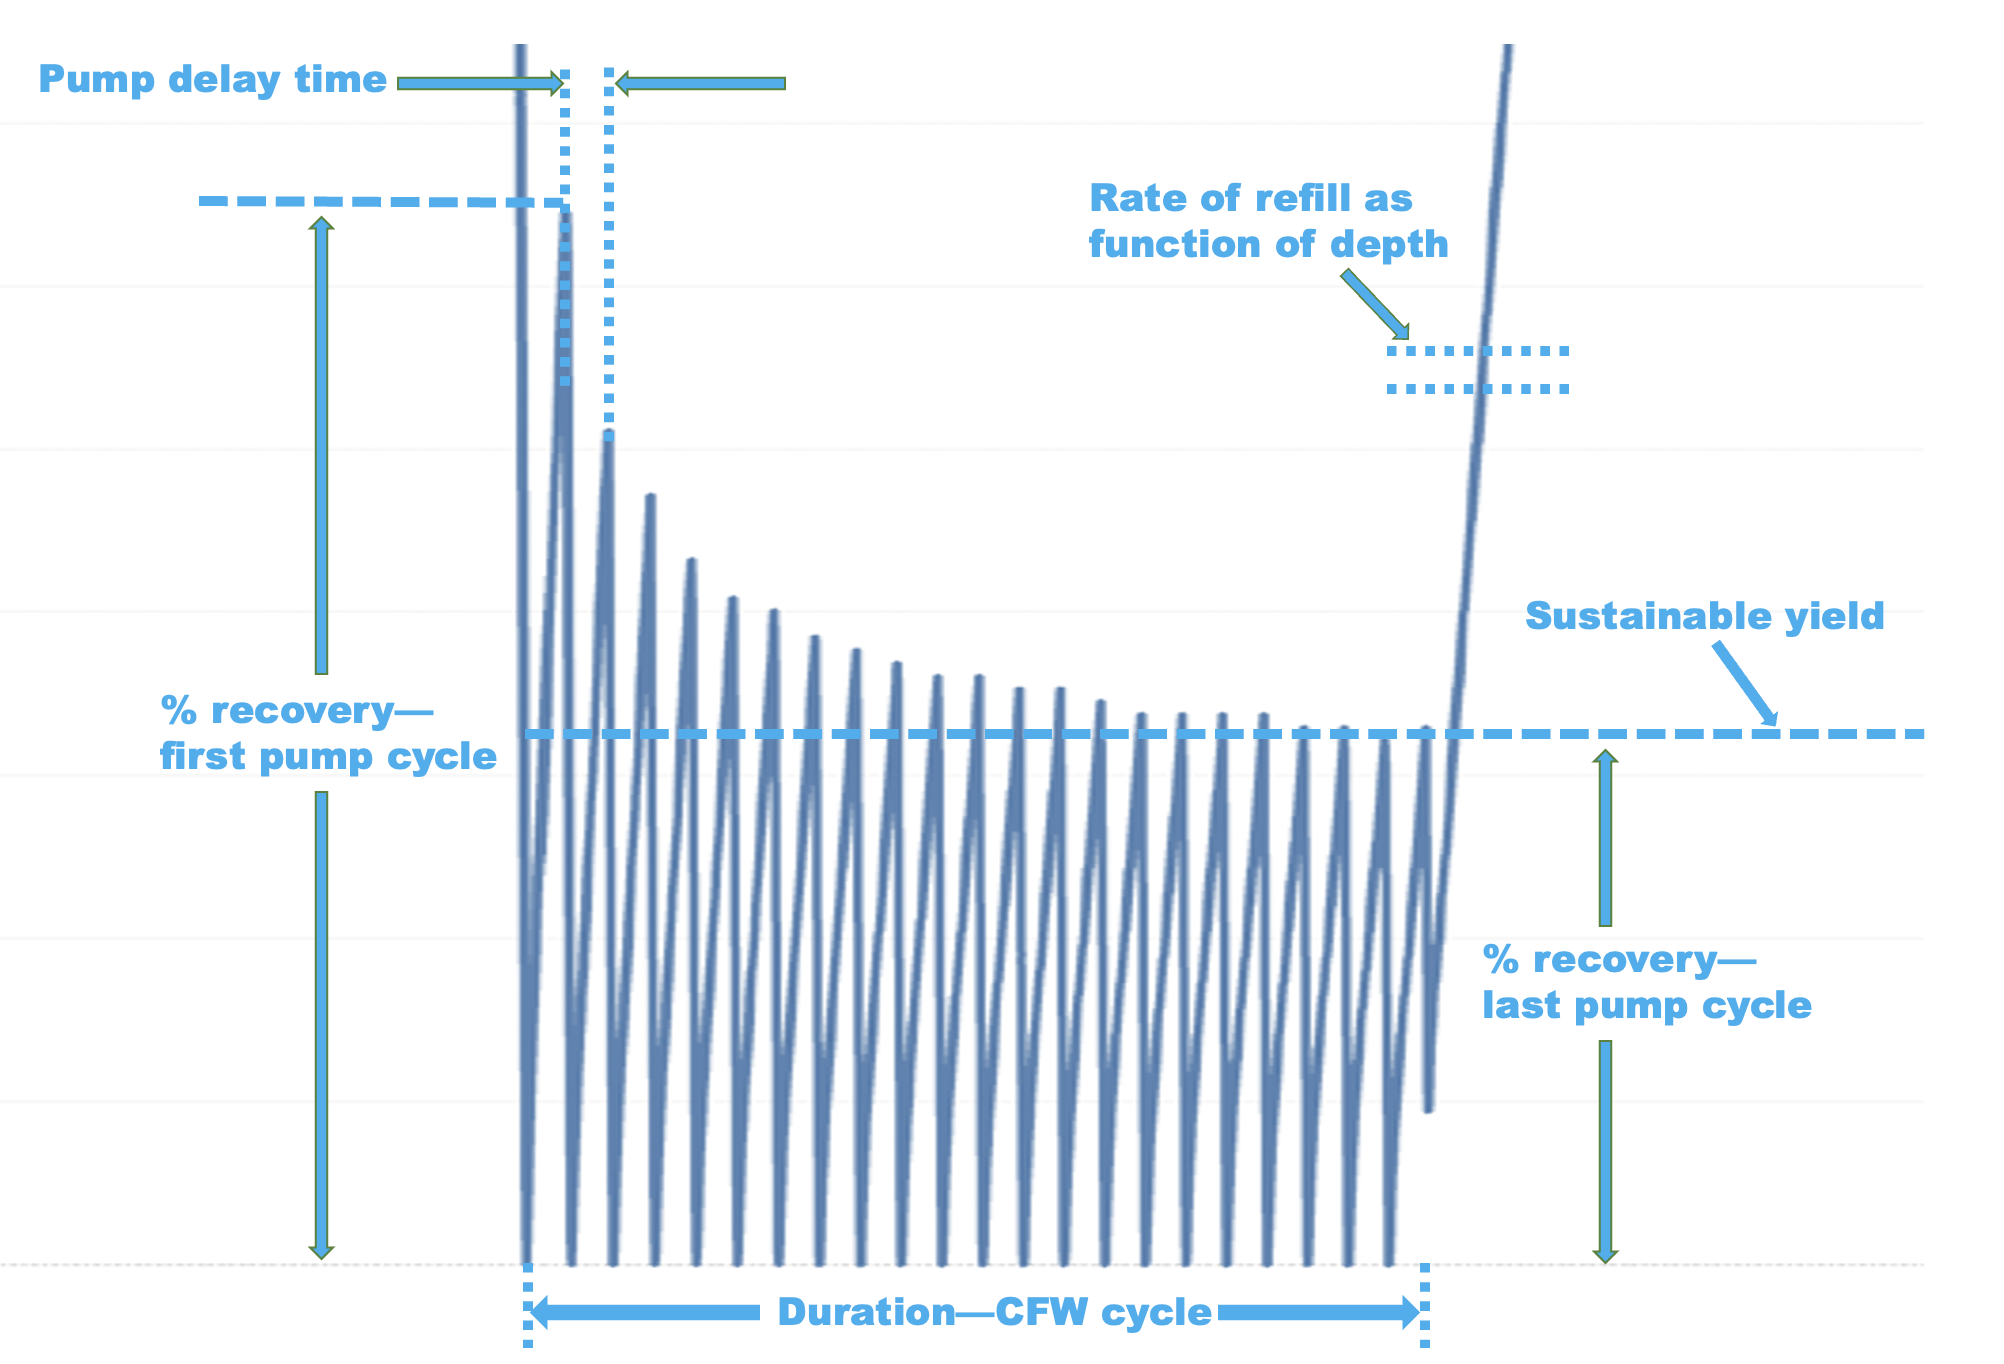
A zoomed-in view showing the detail of individual pump cycles during the CFW cycle.
Call-for-water (CFW) cycle
A call-for-water is initiated when the water level in a tank or reservoir drops below a set threshold and the well pump is powered. Depending on whether the pump's output is greater than or less than the rate at which the aquifer refills the well, one of two sequences occurs:
• If the pump rate exceeds the rate at which the well is refilled with water, the pump cycles on and off until the CFW ceases as shown in the image.
• If the pump rate is less than the refill rate, the water level in the well settles down to the "drawdown" level and the pump operates continuously until CFW ceases. At the drawdown level, the rate at which water is pumped out of the well equals the rate at which the aquifer replenishes the well.
Well operation metrics
Pump delay time
How long the pump relay waits after the well drains before starting the well again.
Pump rate
The pumping capacity of the pump. This is unrelated to the aquifer and only measures the pumping capacity of the pump itself.
Duration—CFW cycle
The duration of a CFW cycle.
Cumulative water pumped
Total water pumped over the CFW cycle.
Aquifer metrics
Static water level
For an unconstrained well, the static water level is, effectively, the top of the aquifer. Over time, as the aquifer is drained due to extraction and refilled by natural water migration, the static water level will move up and down.
% recovery—first/last pump cycle
Measures how much the well refills on the first/last pump cycles during a CFW cycle, expressed as a percentage of the static water level and is a measure of the degradation of the ability of the aquifer to deliver water to the well as more and more water is pumped
Time to refill to 95%
Measures how long it takes for the well to refill to 95% of the static level after a CFW ceases. This is a simple metric that captures the aquifer's ability to deliver water to the well.
Well-level sustainable yield
Water yield that can be sustained if the CFW cycle is extended indefinitely. Well-level sustainable yield is an average pumping rate including periods when the pump is operating as well as when it is temporarily off in-between pump cycles. It is calculated by curve fitting the % recovery for all pump cycles during the CFW cycle.
Rate of refill as function of depth
After CFW, the well refills. Initially, it refills rapidly and then the refill rate slows. Plotting the rate of refill as a function of the depth of water in the well provides information about the transmissivity of the aquifer.